
Neonatal Quality Improvement
Session: Neonatal Quality Improvement 7
 Credit")
 photo")
Emma Kane, B.A. (she/her/hers)
Medical Student
New York Medical College
West Hartford, Connecticut, United States
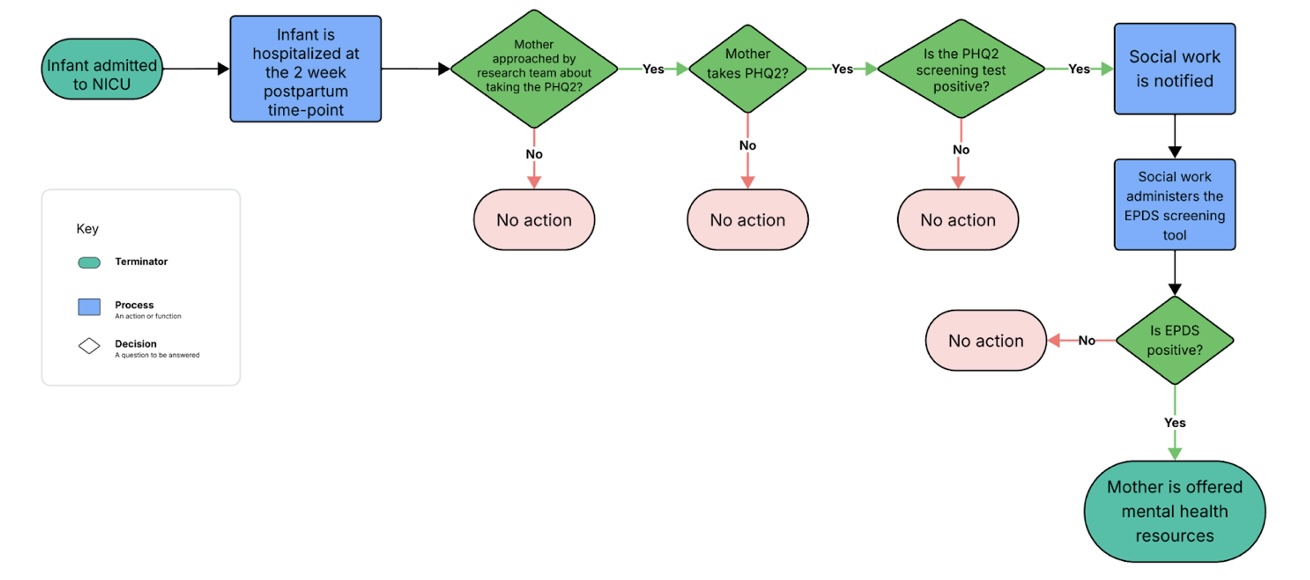 Process Map for PPD screening workflow.
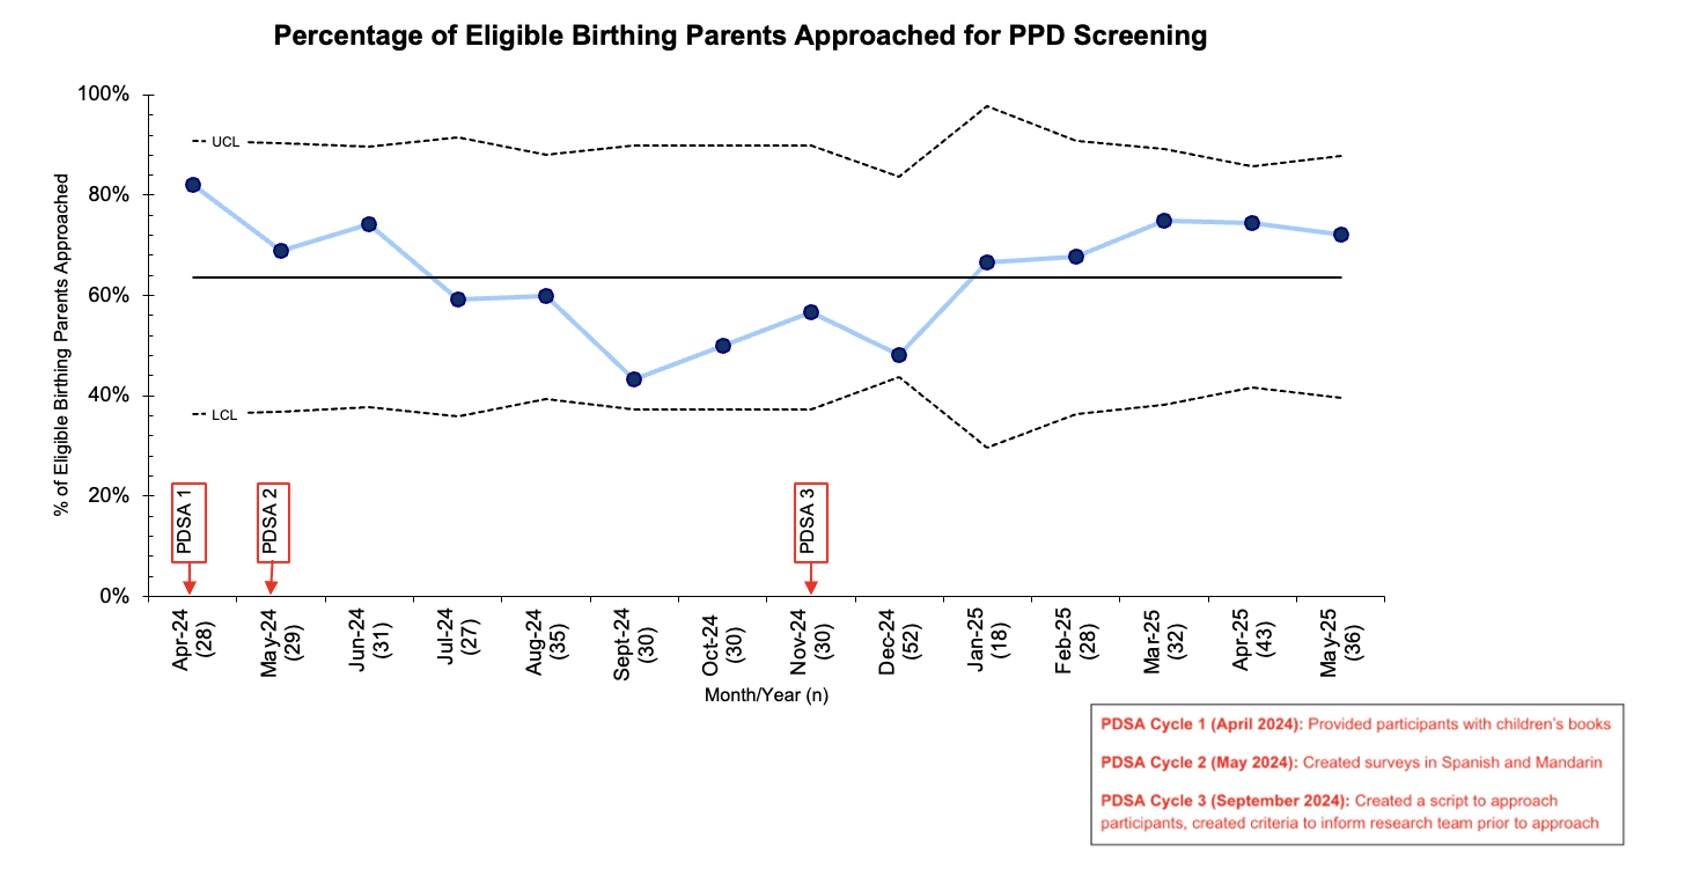 P-chart displaying the approach rate of birthing parents for PPD screening. X-axis includes the number of birthing parents eligible to be screened per month/year. Arrows with PDSA cycle number indicate time of intervention. The solid line indicates the mean center line (CL). Dashed lines indicate upper control limit (UCL) and lower control limit (LCL).
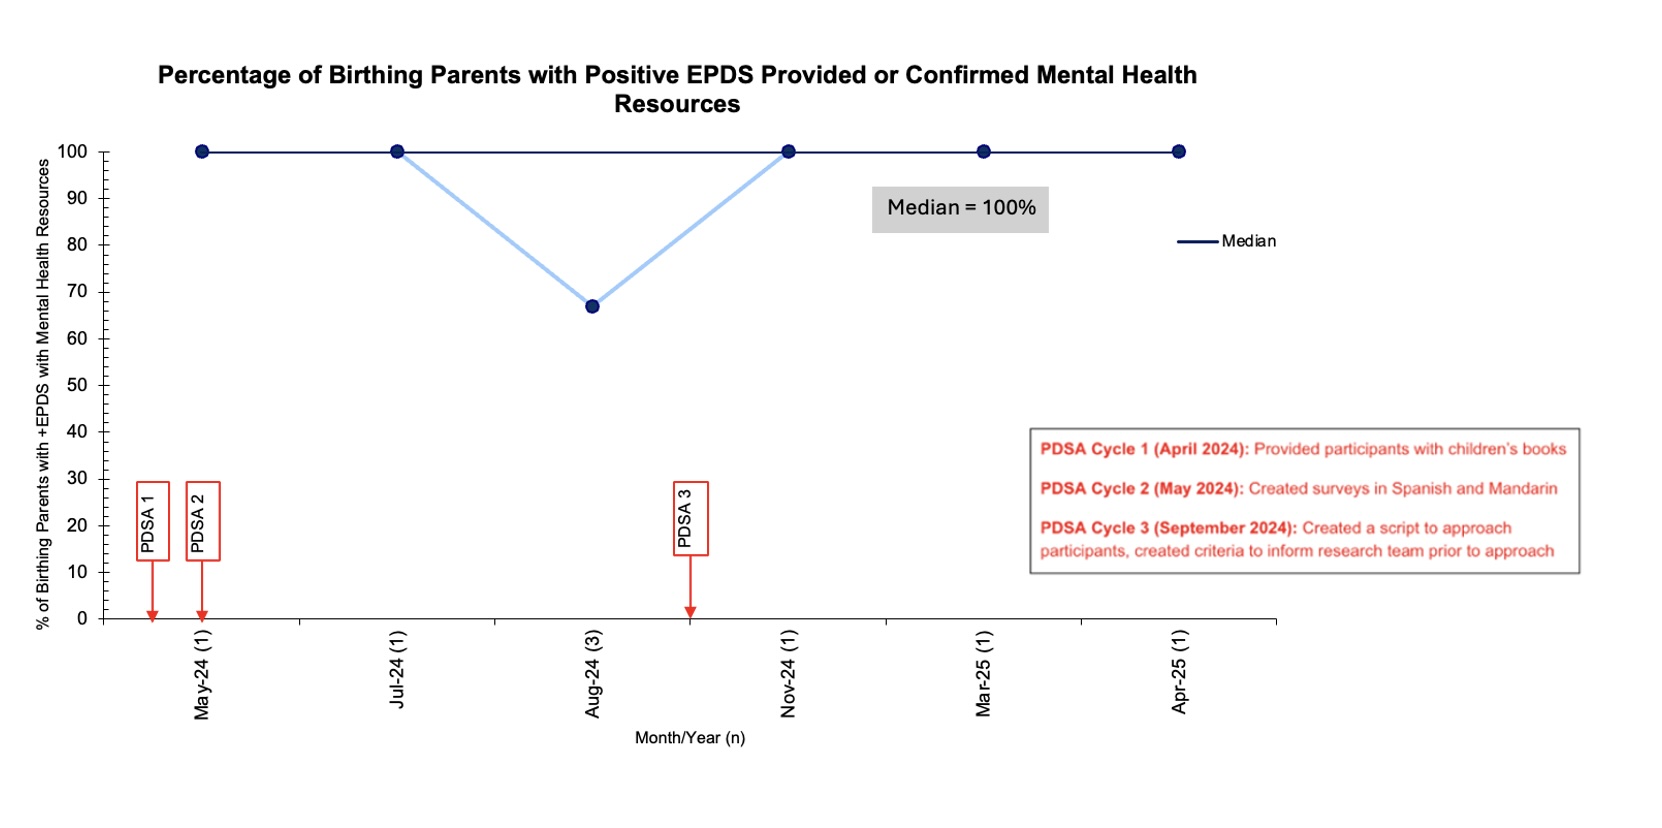 Run chart displaying percentage of screened birthing parents with positive EPDS provided with a referral to or confirmed to have mental health resources. Arrows with PDSA cycle number indicate time of intervention. The solid line indicates the mean center line (CL). Dashed lines indicate upper control limit (UCL) and lower control limit (LCL).